Managing a SMT assembly line or a production factory floor, through a centralized software environment makes perfect sense, in theory. In practice, however, third-party line-management, packages can struggle to collect and aggregate data coming in dissimilar, proprietary formats from machines produced by different brands.
Maintaining compatibility between the software and these different data-interface specifications is always difficult, as vendors publish updates independently without reference to the third-party software vendors.
Although most support industry-standard equipment interfaces such as SECS/GEM, these allow only basic communication. Moreover, the most widely recognized line-management software is expensive and modules must usually be purchased individually.
Facing such challenges, some electronic manufacturing businesses see benefits in committing to one brand for printing, placement and inspection and may use the vendor’s own smart factory tools to gain overall visibility and control. On the other hand, some value the freedom to choose equipment from various brands and find their own way to manage and optimize the machines in their lines.
In either case, the landscape is changing. The world is becoming increasingly focused on Big Data to guide decision making and drive continuous improvement. It works because the computing power to handle vast quantities of process data is more affordable than ever, as is the bulk memory needed for data storage. In addition, the data science to generate actionable insights from the captured information is growing quickly. Manufacturing businesses need to take advantage of these tools to maximize equipment performance and minimize errors, and thus continue increasing their productivity.
Operators, team leaders & managers need data-driven production info to work at their best
An effective SMT line and factory management software package enables manufacturers to visualize operating quality status, monitor SMT lines in real-time, identify the causes of problems and failures, and resolve problems that may occur in any line.
Operators attending to machines in the factory need information at line level to assess operating status, recover machine errors, and restore production. Team leaders, on the other hand, need information about all the factory’s SMT lines to monitor overall progress, stay appraised of Operational Equipment Effectiveness (OEE), and handle any machine issues, as well as dealing with defective products. Engineers and floor leaders acting at a strategic level need analytics applications to help them take the lead on OEE, identify the causes of any problems or failures, and continuously improve and optimize machine settings. Finally, business managers need high-level information to confirm the status of the line at any given time, give instructions, plan future capital investment, and report to the top management.
Yamaha’s printing, placement, and inspection systems collect and share data that enables cutting-edge analytics to reveal deeper insights into process performance when combined with advanced graphical user-interface design.
Utilizing the collected data, the YSUP Dashboard application provides easy visual access to line-level and floor-level performance data such as OEE indices. There are also more powerful analytics tools that provide deeper analysis of printing, placement, and soldering process performance.
These enable users to view trends, as well as correlations between process metrics such as pickup and placement accuracy that can help fine-tune equipment and processes, as well as identifying any defects and quickly diagnosing the causes. Aided by powerful imaging tools, Dashboard can also help analyze exceptional incidents on an individual basis and determine the most appropriate corrective action.
Factory, line and process monitoring
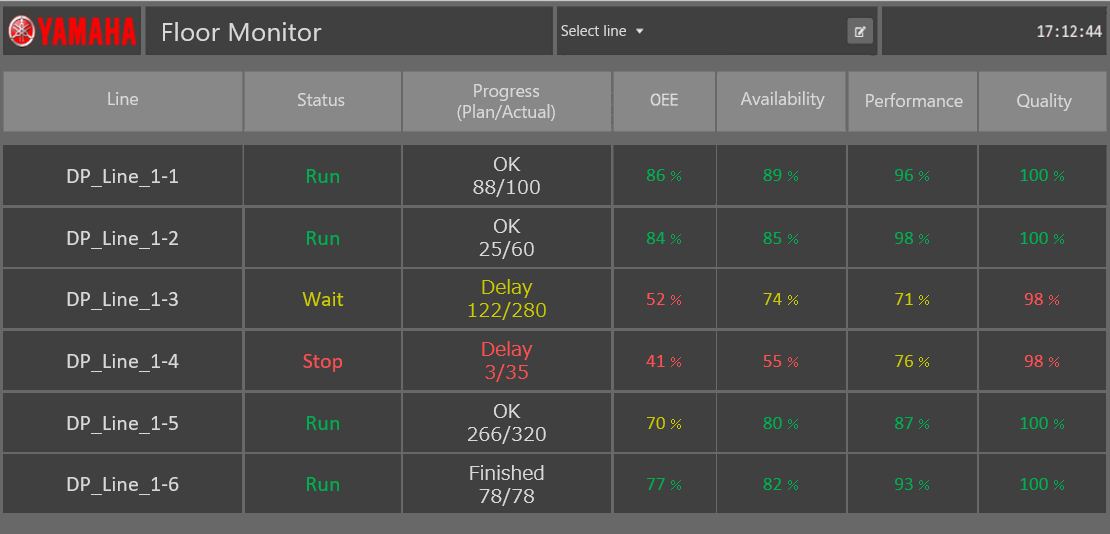
The floor monitor tool shows individual availability, performance, and quality - the composite parts that make up the familiar Overall Equipment Effectiveness (OEE) metric - for each line in the factory.
The OEE is calculated from these and displayed, as well as the pickup rate, defect rate, and the end of line yield.
All are color coded to allow easy at-a-glance assessment (figure 1).
 Figure 1. Color-coded data helps quickly assess status on a line-by-line basis.
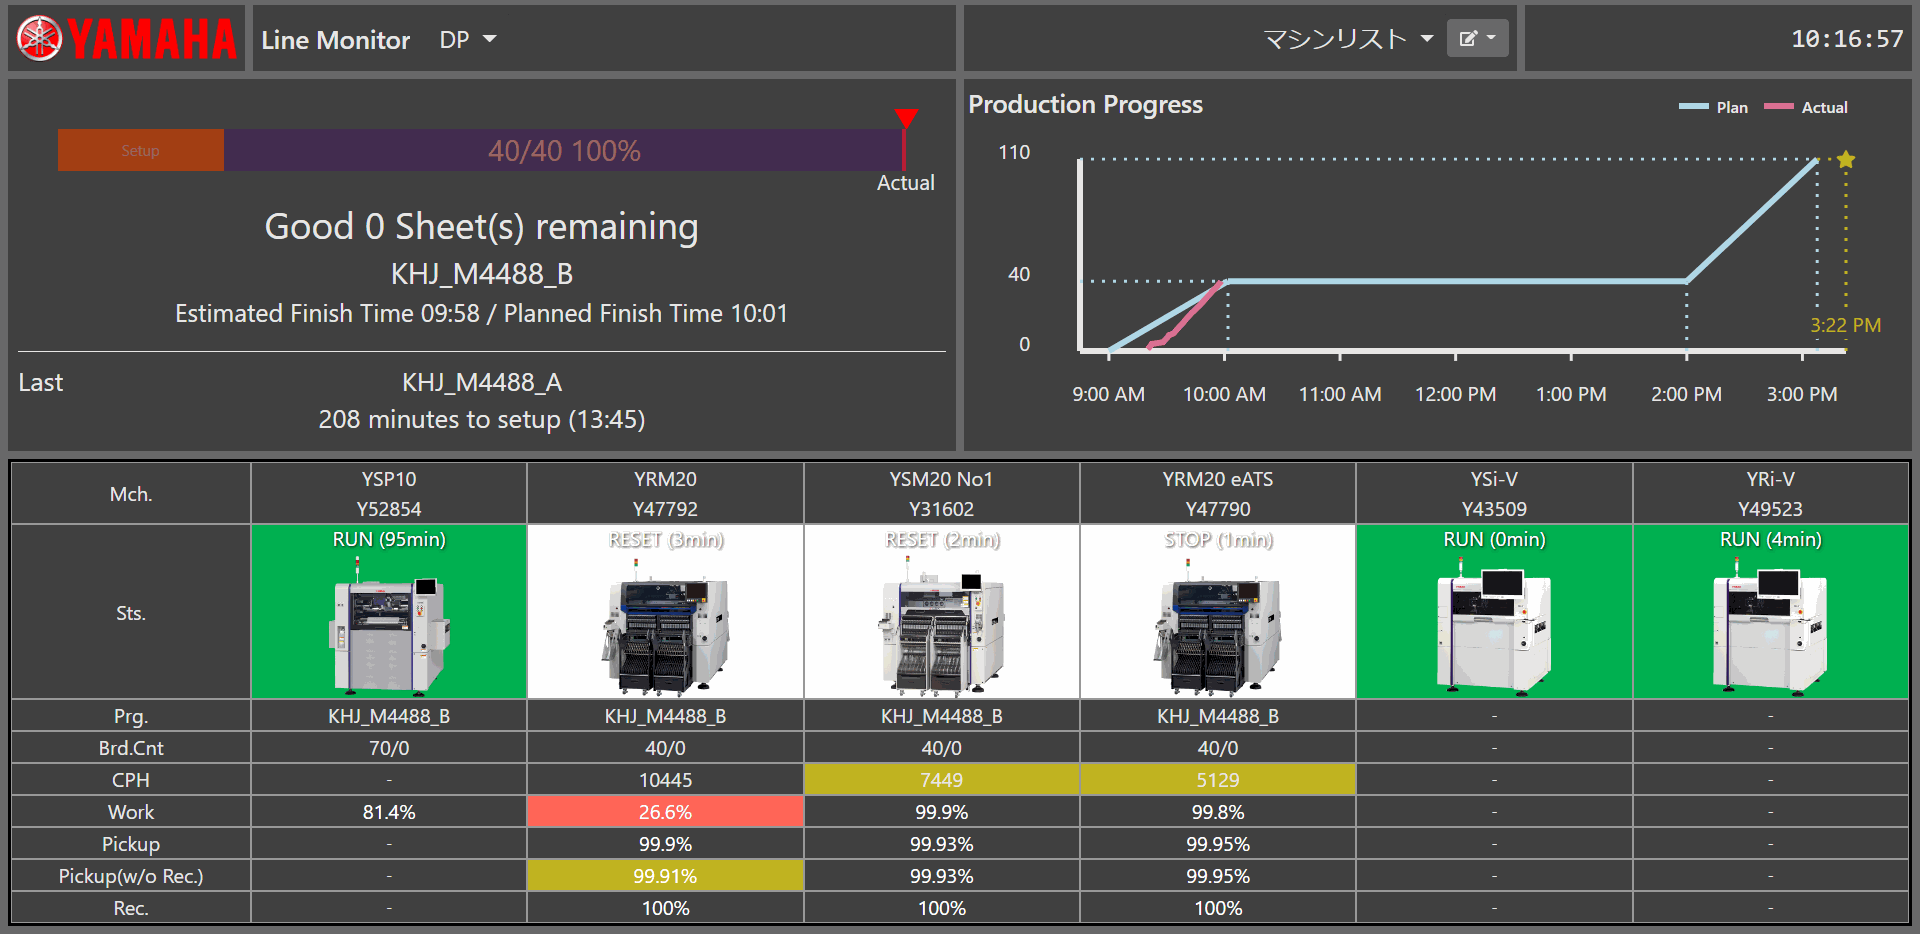
The line monitor view (figure 2) provides a more detailed picture of each line’s performance including batch progress and the job end time, with assembly ID and production-lot information.
The ability to see pickup accuracy and placement accuracy simultaneously helps viewers determine the origin of component-placement defects, helping to direct remedial action such as feeder maintenance or nozzle cleaning.
 Figure 2. Performance metrics for each line help assess production progress in fine detail.
Additionally, for the first time, printing and solder-paste inspection (SPI) analysis are integrated within the environment.
At a glance, the user can view the results at line level. Subsequently, clicking through shows analysis of print condition and inspection results for each individual pad.
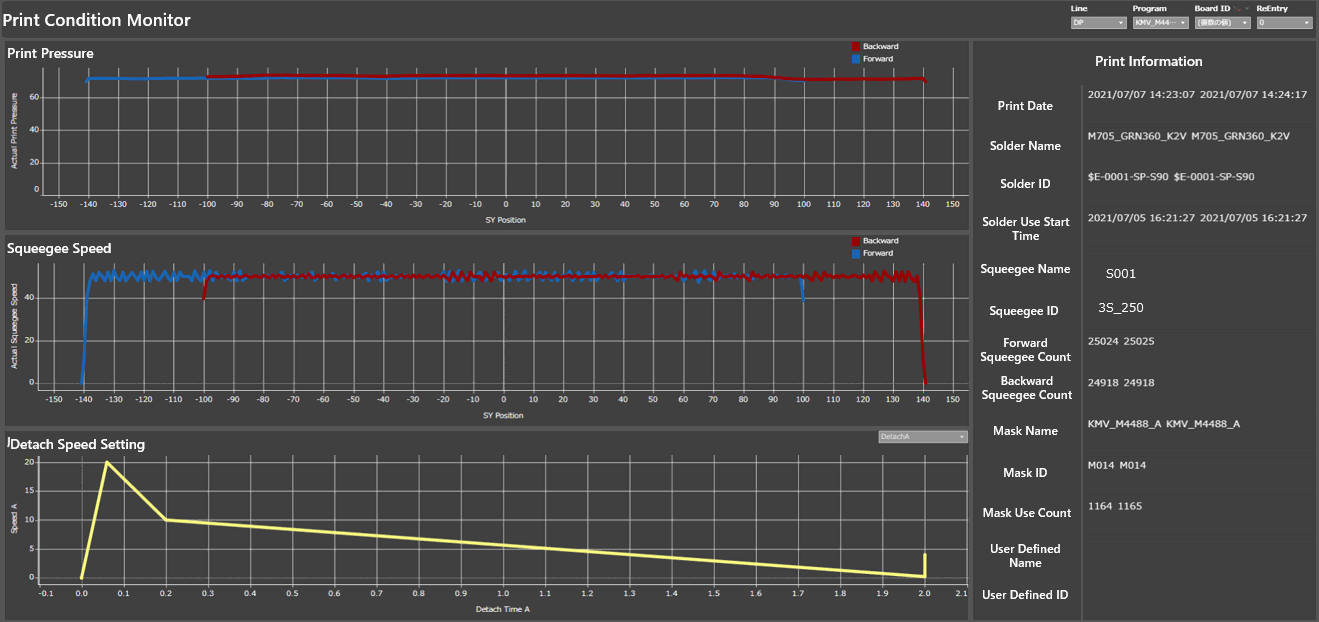
It is also possible to view print trends such as alignment analysis, inspect the relationships between print results and parameters including pressure, squeegee speed, and separation speed in the same window (figure 3), and examine the timing of print events such as paste replenishment, cleaning cycles, and print-error indicators.
This information is available even when SPI data is not present. Together, these Dashboard features help users identify the causes of any printing defects extremely quickly and with pinpoint accuracy.
 Figure 3. Displaying print parameters and IDs in the same window help control the print process.
The Dashboard software helps users take advantage of inspection images to assist troubleshooting. All inspection images, for each unit produced, are stored and can be retrieved within Dashboard to assist the investigation of any defects. Viewing process data such as print and pickup information, alongside the image information, can help users identify the causes of defects that would otherwise require hours of manual analysis to track down.
The following examples of failure analysis show how the use of Dashboard highlights process performance and enables operators to investigate or discount various events and focus their troubleshooting to deliver the greatest return.
Inspection-assisted failure analysis
Upon inspecting an assembled PCB after reflow, a connector was found to have rotated a few degrees during production. Analysis using Dashboard tools confirmed the shift in position, and helped pinpoint the cause by comparing the pickup rate for the connector against other components and identifying the time when the defect began to occur. This enabled the manufacturing team to cure the problem by readjusting the pickup offset. Subsequently, they were able to confirm that no further defects occurred.
Similarly, data from pre-reflow inspection identified alignment errors among 0402 chip resistors placed in a 2 x 4 array. Using solder mark recognition, the misalignment was detected as being greatest in the upper left portion of the array, becoming smaller towards the lower right.
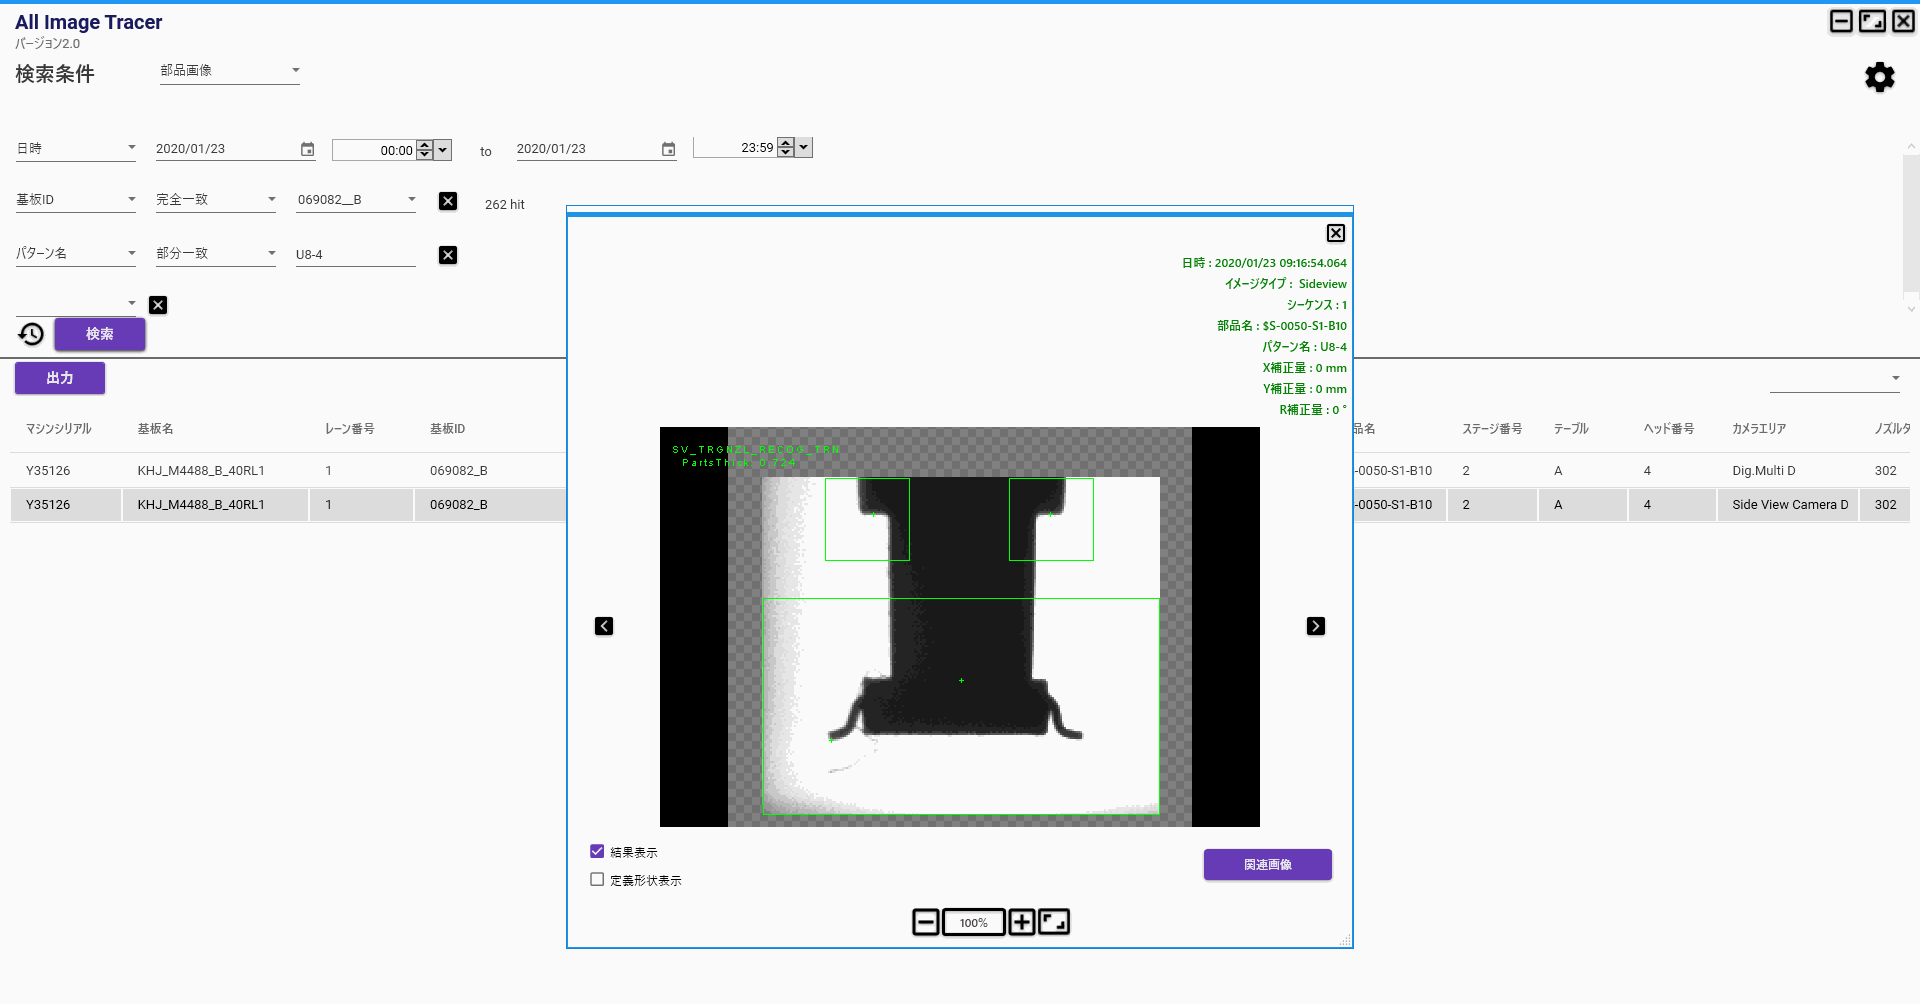
Using the 'All Image Tracer' function to assess the solder-mark image that was used as the reference to align the resistors, showed that the mark had been incorrectly recognized. Correcting the center position of the mark cured the chip-resistor misalignment.
Using the 'All Image Tracer', the YSUP Dashboard tools also helped identify unusual problems such as the presence of foreign objects on the board surface and on the body of a component (figure 4), as well as isolated issues such as a component supplied with a bent lead.
Without these advanced tools, the causes of such defects would have taken a great deal of time and effort to find and rectify.

Conclusion
Big Data is ready to transform electronics manufacturing, with the potential to drive surface-mount assembly to higher levels of throughput and quality.
However, some familiar barriers can hinder data exchange between manufacturing equipment and manufacturing management software. Yamaha SMT manufacture SMT equipment and SMT software, has shown how these barriers can be eliminated.
Building on this, the latest generation of software tools are now emerging to deliver more valuable and actionable insights into factory, line, and process performance than ever before.

Data-driven improvements to SMT assembly based on software innovations